Compute variable importance scores for the predictors in a model and plot
them in a single call; a convenience wrapper around vi and
plot.vi. If you already have a vi object, using
plot() directly is more flexible (its ... are passed on to
tinyplot, whereas vip()'s ... are reserved for
vi).
Usage
vip(object, ...)

# Default S3 method
vip(
  object,
  num_features = 10L,
  geom = c("bar", "point", "boxplot", "violin", "col"),
  mapping = NULL,
  aesthetics = NULL,
  plot_args = list(),
  horizontal = TRUE,
  all_permutations = FALSE,
  jitter = FALSE,
  include_type = FALSE,
  ...
)

# S3 method for class 'model_fit'
vip(object, ...)

# S3 method for class 'workflow'
vip(object, ...)

# S3 method for class 'WrappedModel'
vip(object, ...)

# S3 method for class 'Learner'
vip(object, ...)
Arguments
- object
A fitted model (e.g., of class randomForest object) or a vi object.
- ...
Additional optional arguments to be passed on to vi.
- num_features
Integer specifying the number of variable importance scores to plot. Default is
10.- geom
Character string specifying which type of plot to construct; one of
"bar"(the default),"point","boxplot", or"violin". See plot.vi for a description of each. (The value"col"is accepted as a legacy alias for"bar".)- mapping
Deprecated and ignored (with a warning); as of vip 0.5.0, plots are drawn with tinyplot (base R graphics) instead of ggplot2, so ggplot2 aesthetic mappings no longer apply. Use the
plot_argsargument to set fixed graphical parameters instead.- aesthetics
Deprecated; use
plot_argsinstead. If supplied (with a warning), it is used in place of an emptyplot_args.- plot_args
Named list of additional graphical parameters passed on to tinyplot (e.g.,
col,fill,pch,cex, orlwd), used to set an aesthetic to a fixed value, likeplot_args = list(fill = "forestgreen"). Only needed becausevip()'s...are reserved for vi; with plot.vi you can pass these directly (e.g.,plot(vi_obj, fill = "forestgreen")).- horizontal
Logical indicating whether or not to plot the importance scores on the x-axis (
TRUE). Default isTRUE.- all_permutations
Logical indicating whether or not to plot all permutation scores along with the average. Default is
FALSE. (Only used for permutation scores whennsim > 1.)- jitter
Logical indicating whether or not to jitter the raw permutation scores. Default is
FALSE. (Only used whenall_permutations = TRUE.)- include_type
Logical indicating whether or not to include the type of variable importance computed in the axis label. Default is
FALSE.
Value
Draws a plot as a side effect and invisibly returns the underlying vi object (a data frame of variable importance scores).
Examples
#
# A projection pursuit regression example using permutation-based importance
#
# Load the sample data
data(mtcars)
# Fit a projection pursuit regression model
model <- ppr(mpg ~ ., data = mtcars, nterms = 1)
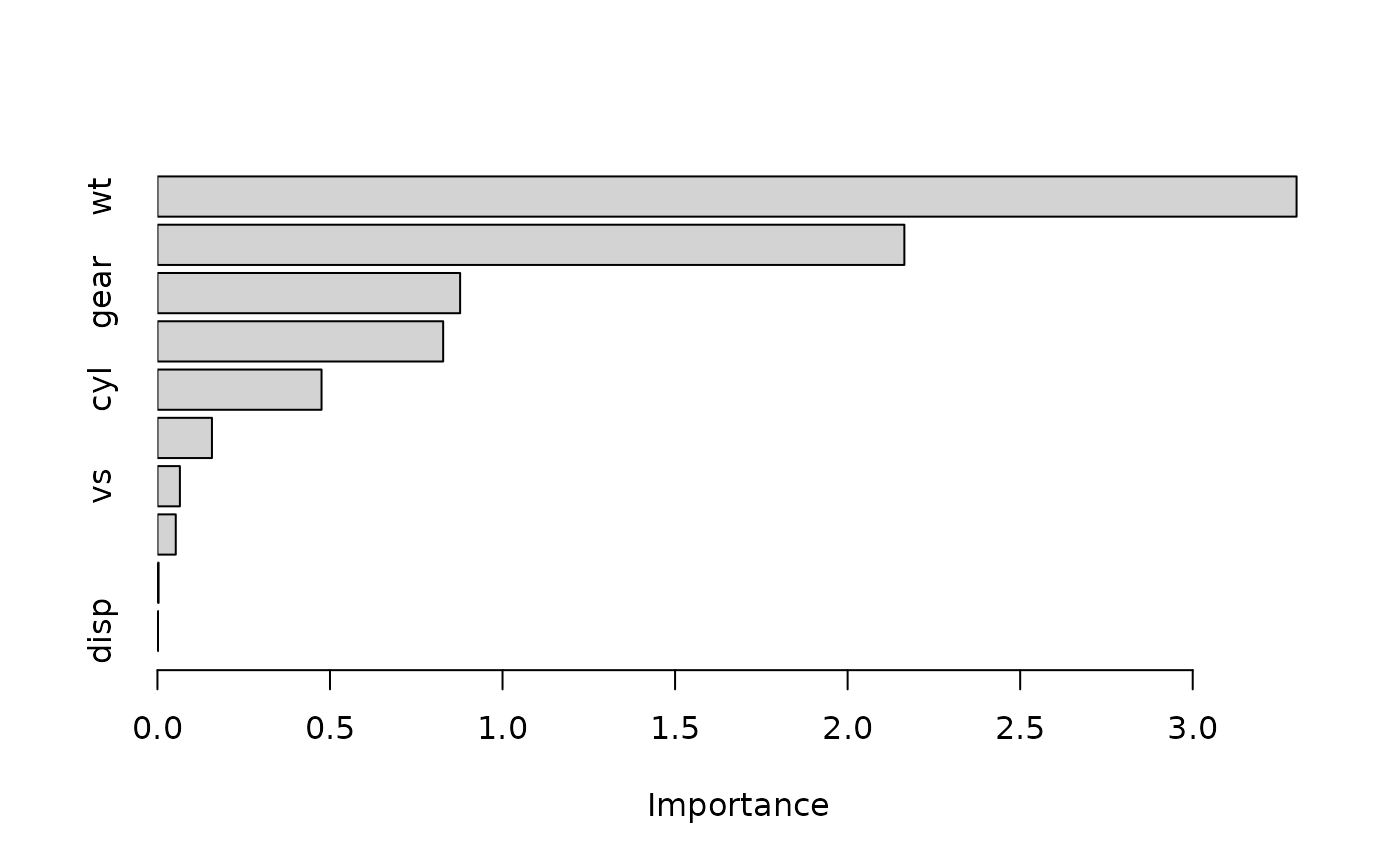
# Construct variable importance plot (permutation importance, in this case)
set.seed(825) # for reproducibility
pfun <- function(object, newdata) predict(object, newdata = newdata)
vip(model, method = "permute", train = mtcars, target = "mpg", nsim = 10,
metric = "rmse", pred_wrapper = pfun)
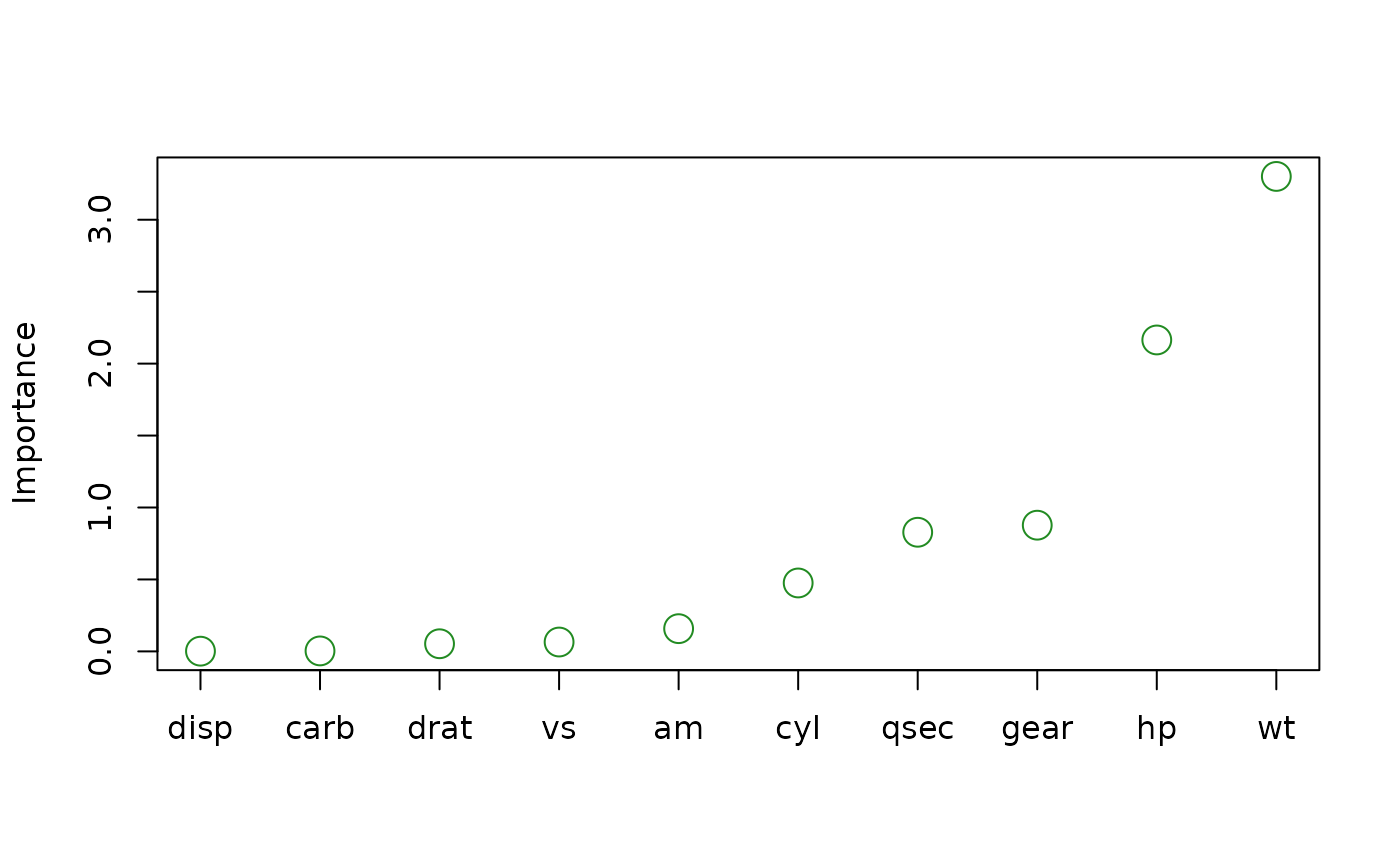
 # Better yet, store the variable importance scores and then plot; `plot()`
# passes its `...` directly to `tinyplot::tinyplot()`
set.seed(825) # for reproducibility
vis <- vi(model, method = "permute", train = mtcars, target = "mpg",
nsim = 10, metric = "rmse", pred_wrapper = pfun)
plot(vis, type = "point", horizontal = FALSE, col = "forestgreen", cex = 2)
# Better yet, store the variable importance scores and then plot; `plot()`
# passes its `...` directly to `tinyplot::tinyplot()`
set.seed(825) # for reproducibility
vis <- vi(model, method = "permute", train = mtcars, target = "mpg",
nsim = 10, metric = "rmse", pred_wrapper = pfun)
plot(vis, type = "point", horizontal = FALSE, col = "forestgreen", cex = 2)
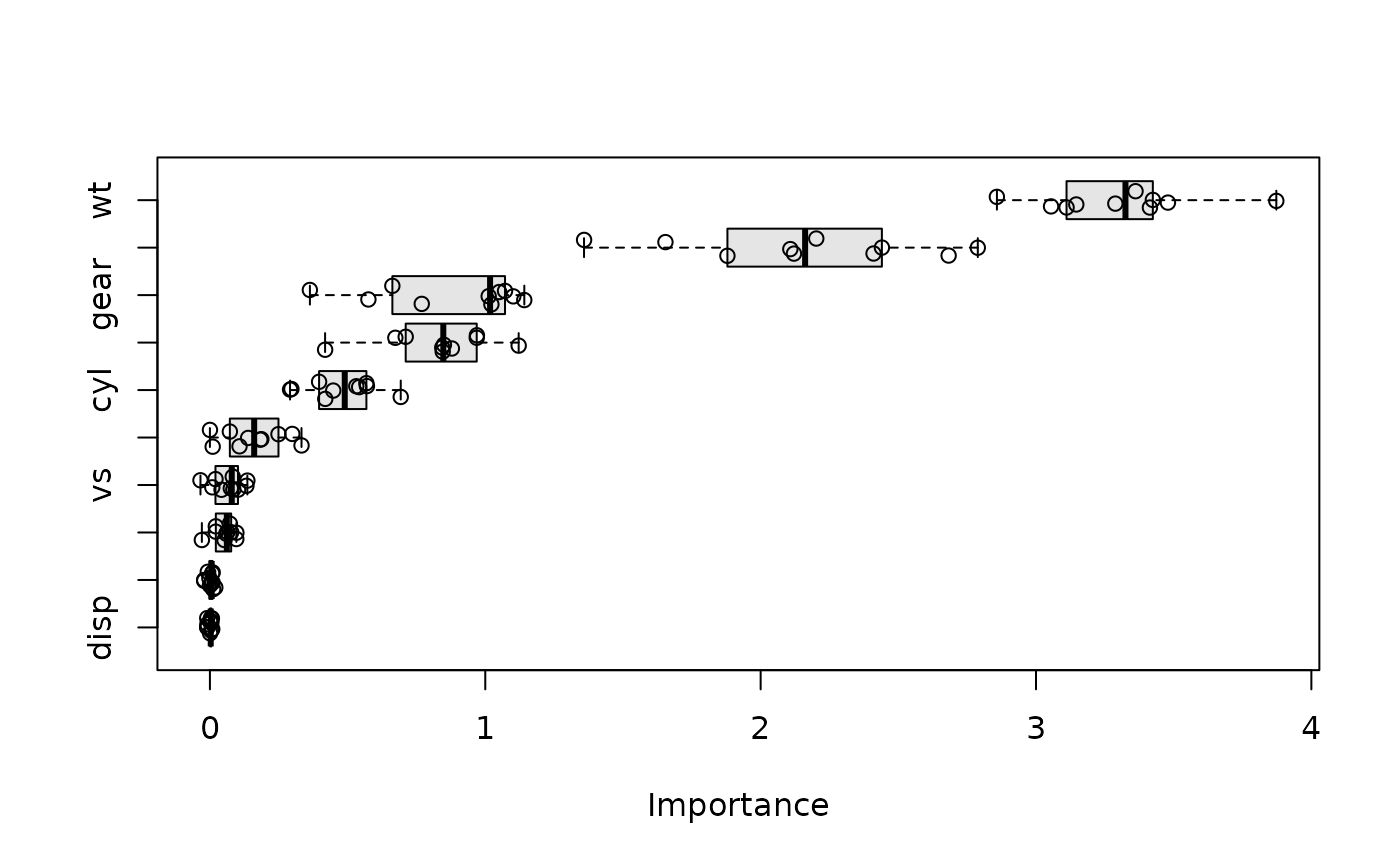
 # Plot unaggregated permutation scores (boxplot plus raw jittered scores)
plot(vis, type = "boxplot", all_permutations = TRUE, jitter = TRUE,
fill = "grey90")
# Plot unaggregated permutation scores (boxplot plus raw jittered scores)
plot(vis, type = "boxplot", all_permutations = TRUE, jitter = TRUE,
fill = "grey90")
 #
# A binary classification example
#
if (FALSE) { # \dontrun{
library(rpart) # for classification and regression trees
# Load Wisconsin breast cancer data; see ?mlbench::BreastCancer for details
data(BreastCancer, package = "mlbench")
bc <- subset(BreastCancer, select = -Id) # for brevity
# Fit a standard classification tree
set.seed(1032) # for reproducibility
tree <- rpart(Class ~ ., data = bc, cp = 0)
# Prune using 1-SE rule (e.g., use `plotcp(tree)` for guidance)
cp <- tree$cptable
cp <- cp[cp[, "nsplit"] == 2L, "CP"]
tree2 <- prune(tree, cp = cp) # tree with three splits
# Default tree-based VIP
vip(tree2)
# Computing permutation importance requires a prediction wrapper. For
# classification, the return value depends on the chosen metric; see
# `?vip::vi_permute` for details.
pfun <- function(object, newdata) {
# Need vector of predicted class probabilities when using log-loss metric
predict(object, newdata = newdata, type = "prob")[, "malignant"]
}
# Permutation-based importance (note that only the predictors that show up
# in the final tree have non-zero importance)
set.seed(1046) # for reproducibility
vip(tree2, method = "permute", nsim = 10, target = "Class",
metric = "logloss", pred_wrapper = pfun)
} # }
#
# A binary classification example
#
if (FALSE) { # \dontrun{
library(rpart) # for classification and regression trees
# Load Wisconsin breast cancer data; see ?mlbench::BreastCancer for details
data(BreastCancer, package = "mlbench")
bc <- subset(BreastCancer, select = -Id) # for brevity
# Fit a standard classification tree
set.seed(1032) # for reproducibility
tree <- rpart(Class ~ ., data = bc, cp = 0)
# Prune using 1-SE rule (e.g., use `plotcp(tree)` for guidance)
cp <- tree$cptable
cp <- cp[cp[, "nsplit"] == 2L, "CP"]
tree2 <- prune(tree, cp = cp) # tree with three splits
# Default tree-based VIP
vip(tree2)
# Computing permutation importance requires a prediction wrapper. For
# classification, the return value depends on the chosen metric; see
# `?vip::vi_permute` for details.
pfun <- function(object, newdata) {
# Need vector of predicted class probabilities when using log-loss metric
predict(object, newdata = newdata, type = "prob")[, "malignant"]
}
# Permutation-based importance (note that only the predictors that show up
# in the final tree have non-zero importance)
set.seed(1046) # for reproducibility
vip(tree2, method = "permute", nsim = 10, target = "Class",
metric = "logloss", pred_wrapper = pfun)
} # }